 |||
|||

Before starting my Ph.D. I was working for a startup real estate company. The company was a startup in culture but not in numbers. It was operating in 12 different cities around the world, and essentially each of these cities was its own company, all operating under the umbrella of the mother company. The revenue was on average 800K dollars per sub-company per month.
In this environment, I ended up in the newly formed BI department, and I was tasked with running, QA-ing, and reporting the KPIs. This is a fancy way of saying that I was responsible to run some extremely large excel files and then sending the output to the management team. The KPIs were essentially three numbers:
Sounds like an easy enough task, everyone thought so, but appearances can be deceiving. Most importantly, each of these 12 cities operated in a slightly different way due to different regulations in each country. That means that you couldn’t create one rule and apply it to all the cities, because that way some cities would be unfairly penalized, while others would be rewarded for no reason. Hence each city needed its own excel file that was mostly identical to all the others, except for one or two different rules.
A second very important difficulty when working with excel files is size. The average size of the excel file was around 120MB. This meant that with my laptop -a pretty good one- I could double click an excel file and then take a five-minute break for some coffee until the file opened. Then I would need to refresh some formulas which would take around 20 - 30 minutes, so I had time to finish my coffee, brew a second one, and then have a smoke. My computer was essentially useless while crunching the numbers.
To make a long story short, to run all 12 files with no mistakes would take me one whole work-day and the reports needed to be sent to management once per week. Then I would need to spend half a day in the QA stage to ensure that no mistakes happened in executing the same algorithmic steps 12 times in 120MB excel files. Honestly, after performing this routing 2-3 times, for a little while I felt completely hopeless. I am pretty sure that many people working in startup environments understand this process. In those stages, it is impossible to have the correct tools in place to perform these kinds of tasks efficiently so companies default to what they know and love, MS excel.
Thankfully, hopelessness didn’t last for long and I immediately started looking for a way to escape the problem. I knew python well enough to understand that the solution to my problem looked something like this:
import pandas as pd
import library_that_solves_my_specific_problem as lib

cities = ["New York", "San Fransisco", "Hong Kong", ...]

for city in cities:
  excel_to_run = pd.read_excel("my_" + city + "_excel_file.xlsx")
  output_excel = lib.solve_my_specific_problem(excel_to_run)
  output_excel.to_excel("output.xlsx")
However, I realized that this library_that_solves_my_specific_problem doesn’t really exist. There are a ton of excel libraries for python on PyPI, such as openpyxl, xlsxwriter and xlwings among others but they could get me all the way. Those libraries were good enough to perform simple tasks such as writing in cells and deleting cell values but they couldn’t do anything useful in an existing excel file. A simplified version of what I was looking for, was to copy formulas from line one, paste them from line one to line 300,000 (that’s why each file was 120MB), and then hit the refresh formulas button. After playing a bit with the files I realized that they had a functionality that could actually prove to be useful. One of them, xlwings could extract macros!
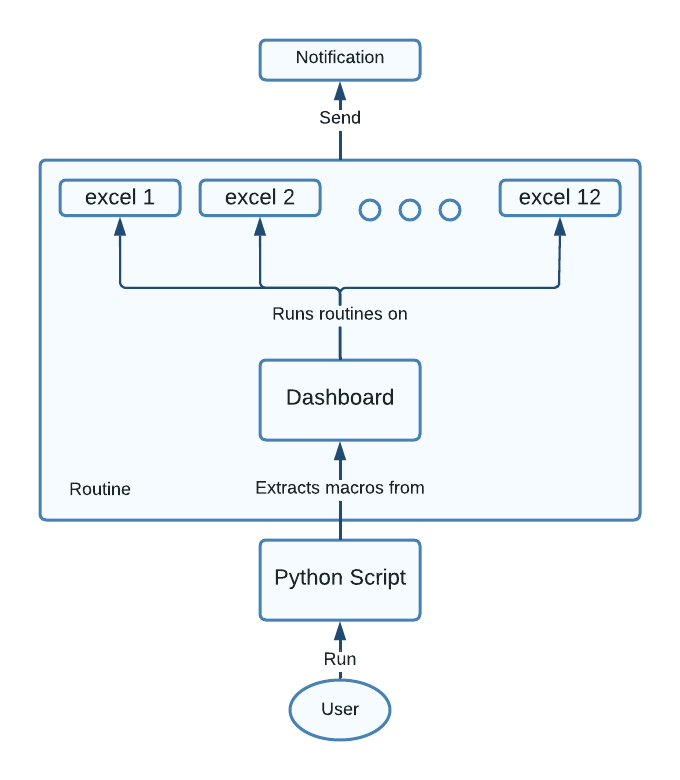
A rough schema of the whole process is presented here.Therefore, the solution was simple. Use
xlwingsin combination with VBA.
VBA is very effective when working with excel files. It is built that way, and like it or not, it’s the best tool to learn if you run routines like this one in excel. However, I wasn’t very keen on learning the ins and outs of the VBA as I wanted this to be the last major excel modeling I would do. The best way to produce VBA code without learning to write VBA code is to use the Record Macro button, on the bottom left corner of each excel file (look it up!).
Hence I create a Dashboard file, which had 12 tabs, one for each city. In each tab I would create (with Record Macro) the following macros
Then I extracted each of these macros to a list in my python script and looped those 7 macros for each of the 12 cities. Lastly, to make sure that the file is running properly, each time the routine for one city has ended the script would send me a notification on my Slack, so I knew that everything was running smoothly.
This post was not a comprehensive tutorial by any means. However, I do believe that it can be useful because it gives the correct direction. I spent countless hours reading articles on the internet that claimed to help you “automate your excel pipelines with python”, but none of them tackled real-life, business analyst, day to day problems. They were using some ideal scenarios to demonstrate a concept, but my scenario always ended up being more complicated.
I spent about one and a half months finishing this project end to end, from taking ownership of the excel files to coding this pipeline. In the end, the whole process runs automatically with the press of a button in less than 8 hours. I was letting the program run overnight while I was sleeping and in the morning we had time to deep dive into the numbers with my team to extract meaningful insight from the results. This is the story of how I managed to change my job from excel operator to business analyst. My manager, trusted me enough to let me spend all this time on the project, and in the end, it paid off. I thank him for that.
We ended up calling this whole process “KPIs semi-automation”. This was because we were still relying on the excel files to produce the numbers and this was not good enough for me. I coded this script, to free up some time to be able to work on the full-automation, in which we would be importing the whole logic, all the corner cases, and all the QA aspects of the routine into the Data Warehouse. Essentially performing these calculations with an SQL script instead of a combination of excel formulas, VBA, python, and faith. However, we couldn’t do that from the start as the intricacies of each city could be very complicated and I needed the time to familiarise myself with them.
In the end, I convinced my manager that we needed to allocate some time to the “KPIs fully-automation” project, and to this day, I consider this to be my biggest professional win. When I started the semi-automation, the company operated in 12 different cities. Nowadays it operates in 25 cities and there are no signs of them slowing down. The legacy solution while versatile and easy to implement was simply not good enough at scale.
If you want to learn more, please feel free to contact me.
Take-home message: If you can fit a small break before the loading screen of an excel file finishes, you are not using the correct tool for the job.
